How to leverage Graph Neural Networks’ solution for link prediction.
Suppose you had information about the investments made by certain investors in the past few months. To make more informed investment decisions, you want to know which companies these investors are likely to invest in during the following months. You start analyzing the data but are soon overwhelmed by the complexity of the problem - indeed, it isn’t easy to reverse-engineer an investor’s strategy. In this article we propose the use of graph neural networks for predicting investments and show that this model has more predictive power than a simple link-prediction-based baseline.
Private investors frequently follow the lead of big players in making investment decisions, a result of herd mentality - the belief that others possess superior information. Yet, this strategy might not always be wise. A more informed approach is predicting the future moves of these major investors, understanding in advance where they're likely to invest. This knowledge allows for more strategic, independent decision-making rather than simply following the crowd.
Below we dive deeper into the predictive problem. We’ll start with the data and its effective representation, which then leads us to a solution based on Graph Neural Networks (GNNs). We’ll briefly discuss the baseline link-prediction model and show that GNNs offer more predictive power. Lastly, we’ll conclude this article with a caveat and some suggestions for future work and research.
Imagine you have a dataset filled with months of investment details such as who invested, which company they invested in, how many shares were bought, and when. One effective way to organize this heap of data is to picture it as a network of connections, or in other words, a graph. In this graph, each investment is a link between an investor and a company. The strength of this link is determined by the number of shares bought.
Since our graph involves two types of entities - investors and companies – known as bipartite.' This means all links are between investors and companies only; investors don't connect to other investors, and companies don't connect to other companies.
By representing our data this way, we can now focus on predicting the future: figuring out which new links, or investments, are likely to happen. For instance, looking at this graph, we might predict whether a particular investor will choose to invest in a certain company. This graph-based approach not only makes our data clearer but also sets the stage for making informed predictions about future investments. Such representation facilitates our goal: given a graph, predict which links are most likely to be formed, i.e., given an investor, answer whether he will invest in a certain company.
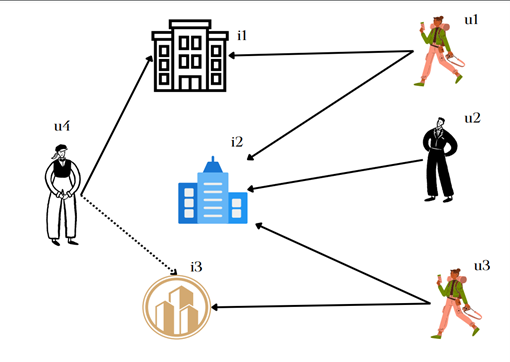
Consider Figure 1 below, the solid lines indicate present investments made by investors u1, u2, u3, u4. We see that investor u1 has invested in the company i1. The question is whether he will also invest in company i4. For example, whether a link would appear between u1 and i4, as indicated by the dashed line.
Fig. 1: Investors and companies forming a graph. Solid lines represent the present investments, and the dashed line represents a potential investment.
Graph Neural Networks are a graph-based family of machine learning models that work well with interconnected data sets. They work by spreading information from one point, or node, to its connected neighbors, much like sharing news with your neighbors. This process is called message passing, and it helps GNNs understand and learn from the data. Typically, they focus on the immediate connections, but sometimes they can reach further, up to several connections away, to gather more context.
While the basic GNNs treat all connections equally, there is a special type called a Graph Attention Network (GAT). GATs pay special attention to the importance of each connection, much like how in a conversation, you might pay more attention to certain people. They assign a weight, or importance, to each neighbor, learning over time which connections are more crucial, especially when there aren't many to begin with. This feature is particularly useful when dealing with sparse datasets, where connections are few and far between, allowing GATs to focus on what matters most to make smarter, more informed decisions.
As you will see below, we also integrate a temporal component for the connections within the graph, i.e., attaching age to the links.
Faced with the problem of link prediction and having identified GATs as particularly suitable for this use-case, we have designed a predictive pipeline as shown in Figure 2 below.
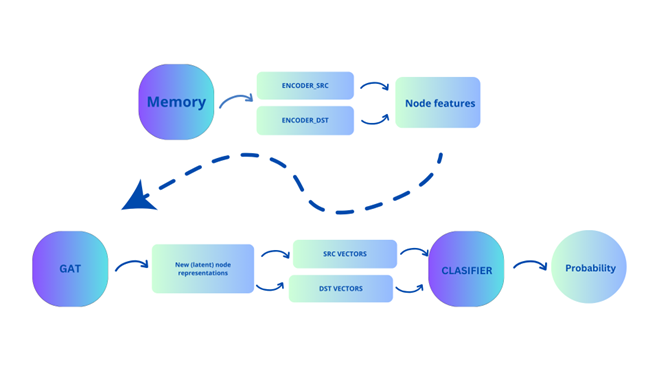
Figure 2: Predictive pipeline - predicting probability of a link being formed.
Below we discuss the elements included in the pipeline:
Memory: This part contains the initial embeddings for both investors and the companies and is immutable. Suppose there are N investors and M companies. For investors, the initial embeddings are vectors with length M, and non-zero entries corresponding to the number of shares this investor bought from a specific company (index based). Analogously, the initial embeddings for companies are vectors or length M, with non-zero entries corresponding to the number of shares this company sold to a specific investor (index based).
Encoder SRC/DST: Given that the initial embeddings for both the investors and the companies are of different lengths, we pass these embeddings through their respective encoders, which transforms them to vectors of the same lengths. These newly obtained vectors are what we call Node features in the pipeline above. The SRC (short for ‘source’) corresponds to investors, and DST (short for ‘destination’) corresponds to companies.
GAT: The Node features are then used as input for GAT. We used two Graph Convolutional Layers, which means that the node propagation goes 2-hops away from the origin node. Besides the node features, we also use an edge feature: edge_age, which corresponds to the temporal distance of this investment from the last training day. Basically, the number of days between this investment and the latest date in the training set.
New node representations: These are new node features, output from GAT, which are then split into SRC and DST nodes.
Classifier: Given investors and companies embeddings, we are now ready to train a classifier which will - given an investor-company pair - give a probability of existence of this particular link/edge/investment. The training procedure is as follows: for each investment (edge in a graph), we perform an operation between the investor and the company vector and associate the result of this operation with label 1. We opted for the Hadamard product as a vector operation, which is basically an element-wise multiplication of two vectors. As for the label 0, we sampled the same number of investor-company pairs between which there is no edge. The classifier is then ready to give the probability of an edge existing between an investor and a company. Needless to say, to predict the actual number of shares, we should use a loss function suitable for regression problems instead of binary cross entropy.
The above predictive pipeline has been implemented with the PyG library.
Since we had a timestamp as part of the dataset, we form a train and test set by first sorting the investments by timestamp, and then do the 80/20 split, ensuring there is no data leakage.
The problem at hand can also be tackled with a recommender system, which can be seen as a link-prediction approach. Given user-item interactions, predict which items the users are likely to consume in the future. In our use case, the input being user-item-rating triplets, is mapped as follows: users correspond to investors, items correspond to companies, and number of shares correspond to ratings. We used a weighted matrix factorization model with implicit feedback as a baseline. It is implemented in the ‘implicit’ Python library.
Below on Figure 3 we show results on the last 5 epochs against the test set. While it is reasonable to expect that the results would improve with further epochs, we must state that the rather high quality is also due to a relatively low number of companies to choose from, relative to the number of investors. In any case, the main metrics associated with the recommender did not surpass a maximum of 65%.
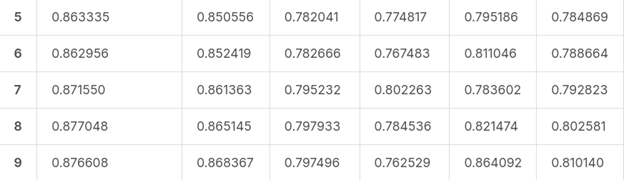
Figure 3: Metrics for the last 5 epochs of the model presented in Image 3, calculated against the test set.
In conclusion, predicting future investments by understanding the patterns of prominent investors is a complex yet critical endeavor in the realm of private investing. This article highlighted the power of Graph Neural Networks, specifically Graph Attention Networks, in enhancing the predictive accuracy of investment behaviors over traditional link-prediction models. By transforming investment data into a bipartite graph, we enable a more intuitive and potent analysis, leading to more informed and independent investment strategies. While the results show promise, they also underscore the importance of continued innovation and research in this area, particularly in refining models and exploring different architectures for better accuracy and utility in real-world scenarios. As the landscape of investment continues to evolve, the integration of advanced predictive models like GNNs will undoubtedly become a cornerstone in strategic investment planning.
Resources
Authors’ LinkedIn:
Mirza Klimenta, PhD: https://www.linkedin.com/in/mirza-klimenta/ Malek Chahin: https://www.linkedin.com/in/malek-chahin-68229816a/
Malek Chahin is a seasoned Data Scientist/Machine Learning Engineer with 5+ years of industry experience. He possesses demonstrated experience in NLP, traditional Machine Learning and anything vectors/embeddings related. He is passionate about algorithms and efficient code.
Mirza Klimenta received his PhD in Computer Science from the University of Konstanz (Germany) at age 25. While in academia, Mirza worked in the fields of dimension reduction and graph embedding, and his work has been recognized by the scientific community. As a (Senior) Data Scientist, Mirza focuses on Recommender Systems and Algorithm Engineering. His most notable work is in the design and implementation of a Recommender System powering ARD Audiothek, one of the most popular audio-on-demand platforms in Germany. He is also a writer of literary fiction.